

Testing Methodology and Performance Benchmarks
Testing Objectives and Setup
We will be running the Gigabyte Z390 AORUS XTREME with the hardware components we have on hand to understand how well the system performs. We will first look into the general performance of the system, then focusing on the CPU, Memory, Storage, iGPU and dedicated GPU performance. On top of that, with our baseline results created from the stock setup, we will overclock the system to see how much more performance we can achieve and sustain on the processor with the features on the Z390 AORUS XTREME motherboard.
| Specs | Main System |
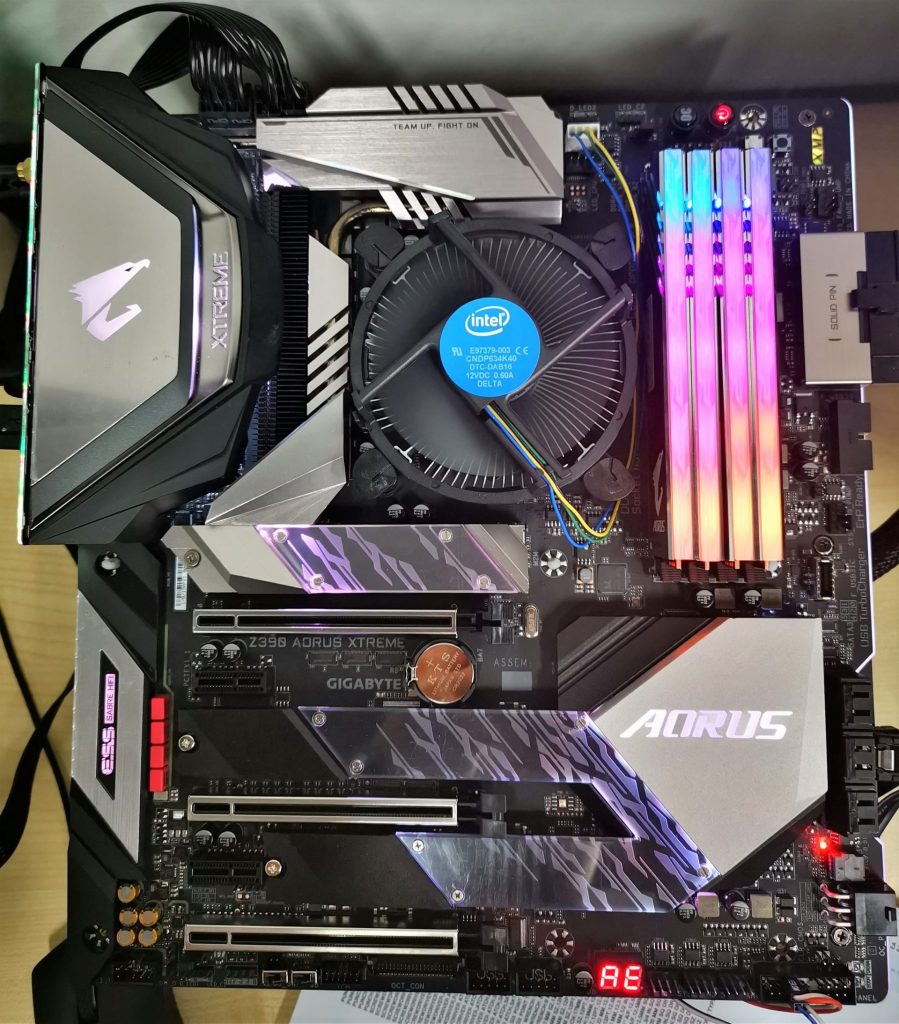
| CPU | Intel Core i9 9900K (Engineering Sample) |
| RAM | AORUS RGB Memory 3200MHz CL16-18-18-38 2 x 8GB DDR4 Kit |
| Storage | Plextor M8V M.2 SATA SSD 256GB |
| GPU | Intel HD Graphics 630
Gigabyte GeForce RTX 2070 Gaming OC 8G |
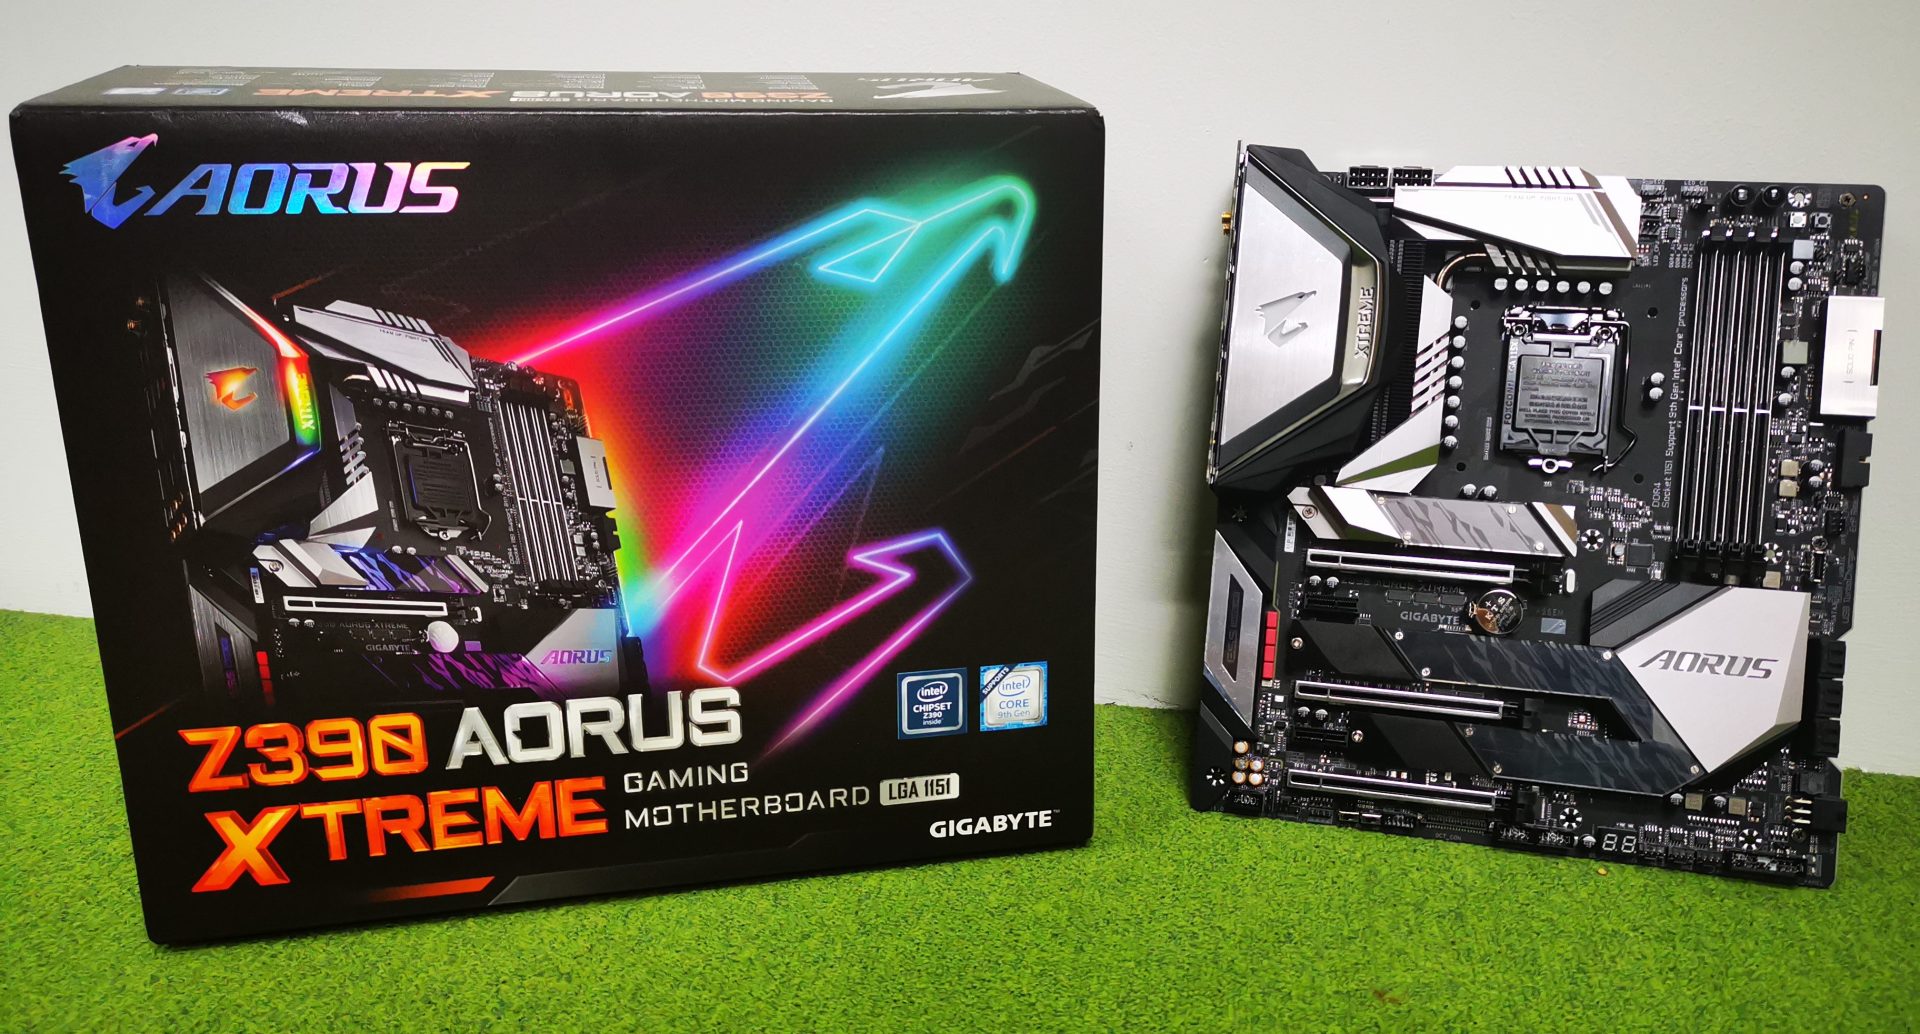
| Motherboard | Gigabyte Z390 AORUS XTREME |
| CPU Cooler | Intel Stock Cooler
Cryorig A80 280mm AIO Hybrid Liquid Cooler (when in OC) |
| OS | Windows 10 Pro 64 bit |
| Drivers | NVIDIA 416.34 (RTX 2070) Intel VGA Driver 100.6291 (iGPU) |
Performance Results
General Performance Testing
Futuremark PCMark 10
PCMark 10 Extended provides organizations with a complete assessment of system performance beyond typical office work tasks. It also includes demanding graphics and physics tests that focus on GPU and CPU performance.
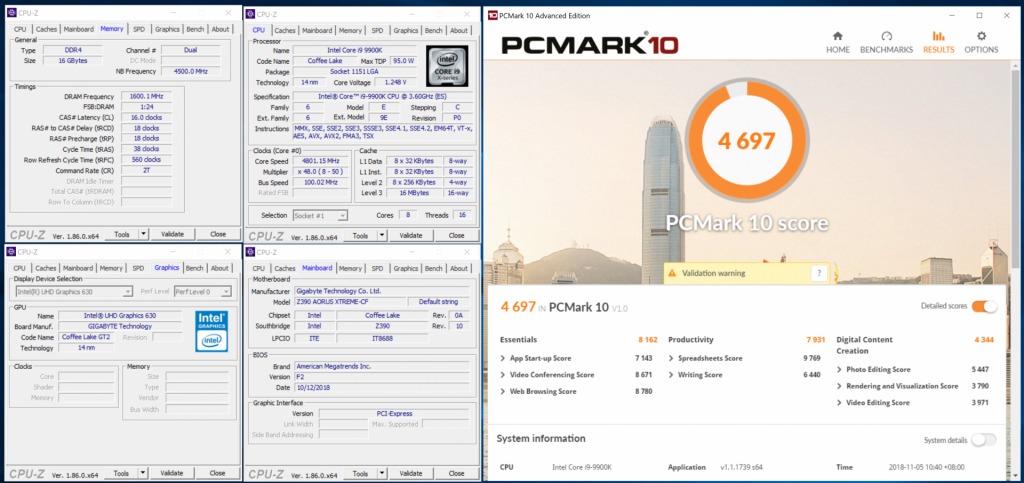
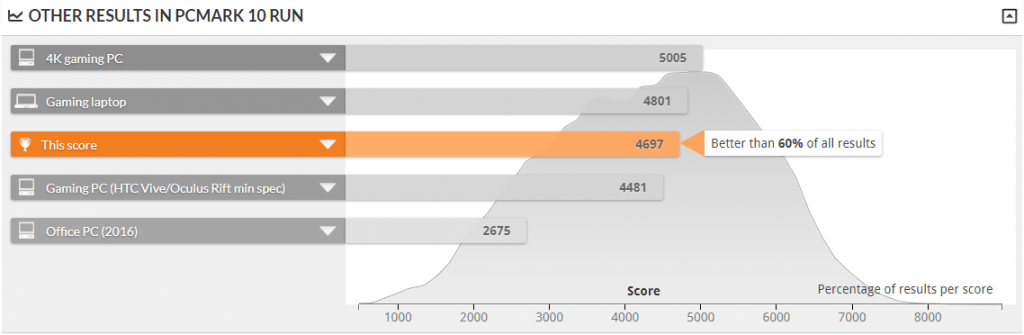
The test which was tested without any dedicated graphics card yield a score of 4697. Of course, we will expect the system to score a much higher score if a dedicated gaming graphics card was installed. This will be shown later on our synthetic graphics test. Regardless, the PCMark 10 run gives a good gauge of how the whole system performs right out of the box with an Intel processor. It’s still above average.
WebXPRT 2015
WebXPRT 2015 uses scenarios created to mirror the tasks you do every day to compare the performance of almost any Web-enabled device. It contains six HTML5- and JavaScript-based workloads: Photo Enhancement, Organize Album, Stock Option Pricing, Local Notes, Sales Graphs, and Explore DNA Sequencing.
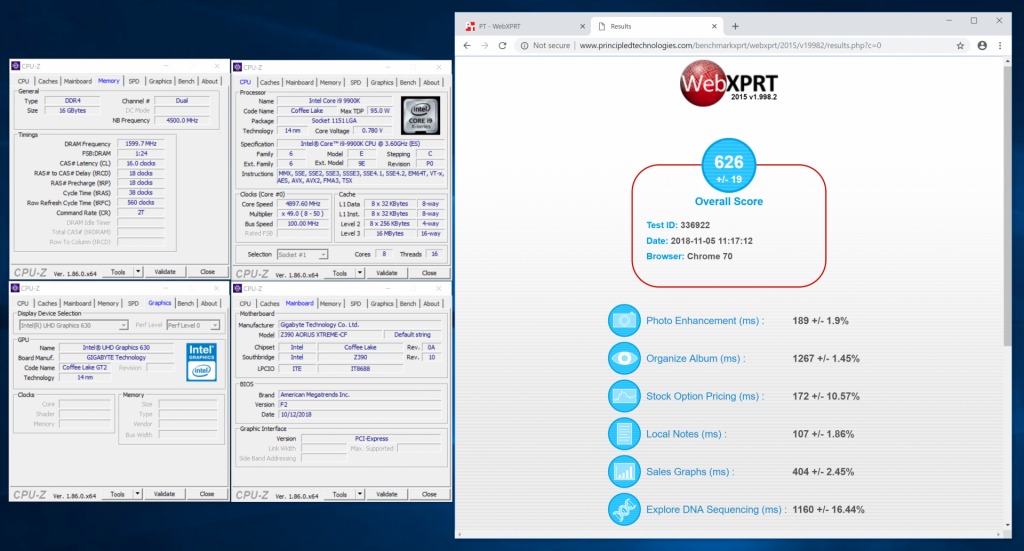
WebXPRT results shown that the system should be able to carry out online applications very smoothly without any problems at all. All tests were completed smoothly at stock CPU settings.
Passmark Performance Test
PassMark PerformanceTest benchmarks a PC performance using 32 standard benchmark tests in five test suites.
- CPU tests Mathematical operations, compression, encryption, physics.
- 2D graphics tests Vectors, bitmaps, fonts, text, and GUI elements.
- 3D graphics tests DirectX 9 to DirectX 12 in 4K resolution. DirectCompute & OpenCL
- Disk tests Reading, writing & seeking within disk files + IOPS
- Memory tests Memory access speeds and latency
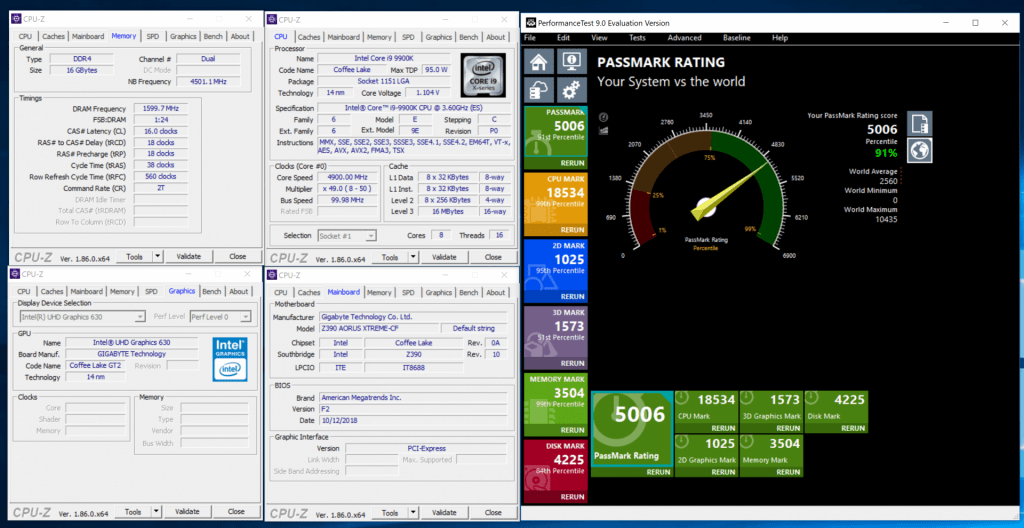
With PassMark, we can easily do the comparison with a database of components. As we can see, the CPU reaches straight into the 99th percentile. As expected, the integrated graphics solution loses out in the 3Dmark test. The motherboard was able to support the CPU, memory and disk well to allow them to reach top scores in the overall PassMark tests.
CPU Performance
Cinebench R15
CINEBENCH is a real-world cross platform test suite that evaluates your computer’s performance capabilities. CINEBENCH is based on MAXON’s award-winning animation software Cinema 4D, which is used extensively by studios and production houses worldwide for 3D content creation.
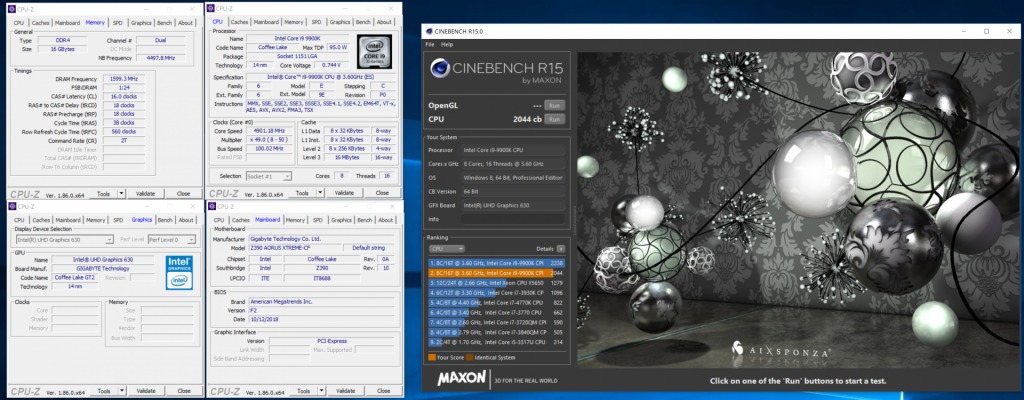
The Gigabyte R15 ran smoothly and completed with a score of 2044cb points. The motherboard was able to sustain the CPU at stock speeds without any throttling or mishaps.
SuperPi
Super PI is a single threaded benchmark that calculates pi to a specific number of digits. It uses the Gauss-Legendre algorithm to compute pi to 232 digits.
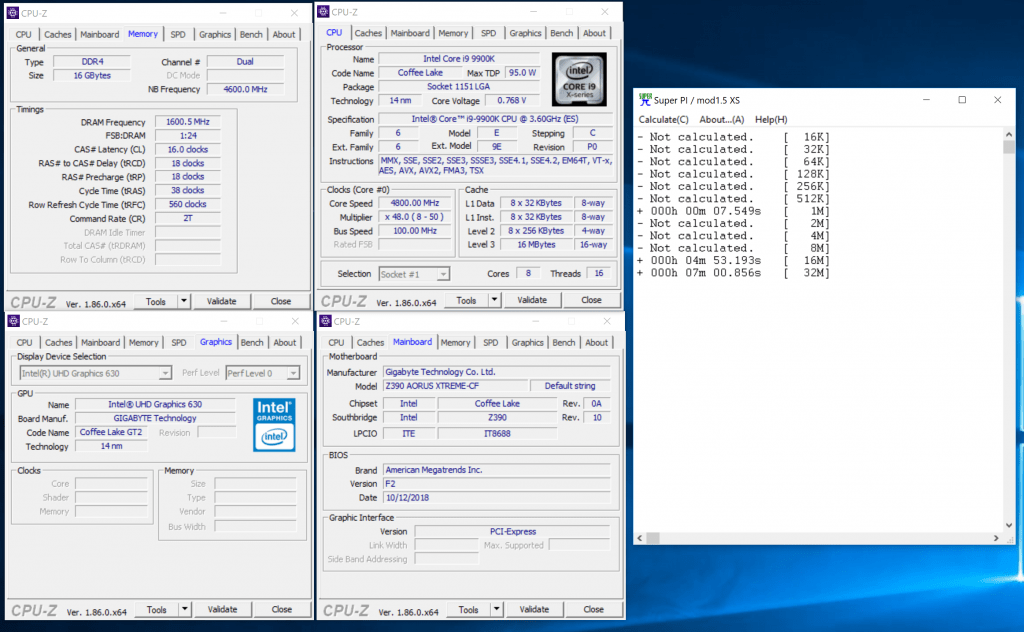
Similarly for SuperPi test, the motherboard and CPU completed without any hiccups and achieved good score of 7min for the 32M test.
7-Zip
7-Zip is a free and open-source file archiver. The benchmark determines the speed of the system compressing and decompressing of archives with LZMA methods.
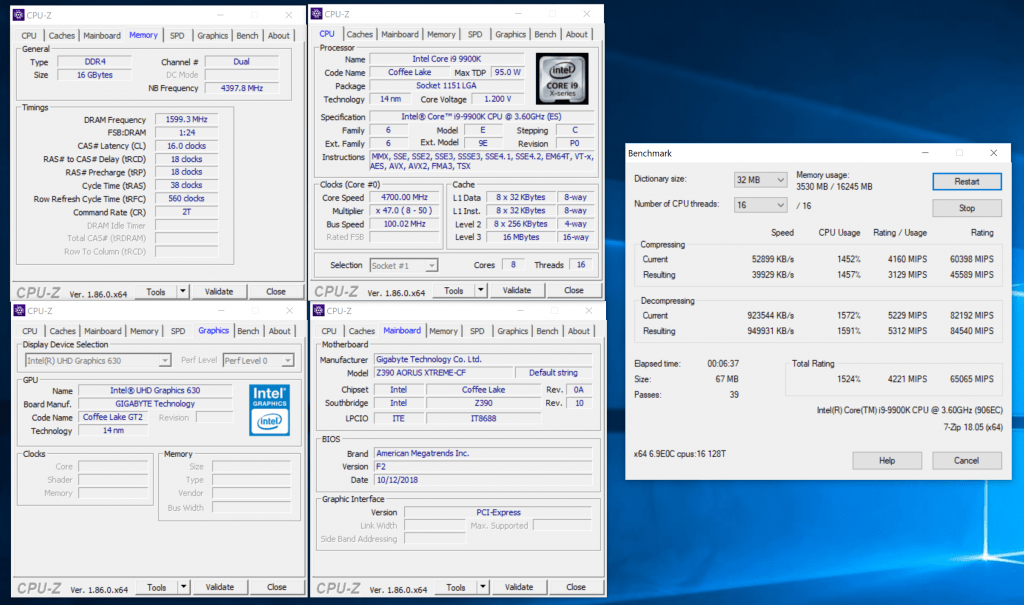
For more real-world test on compressing and decompressing of archives, the CPU and chipset was able to do operate at about 40MB/s and 959MB/s respectively.
Memory Performance
AIDA64
AIDA64 is a system information, diagnostics, and auditing application developed by FinalWire Ltd. It includes a memory benchmark test which shows the system’s memory latency and speed.
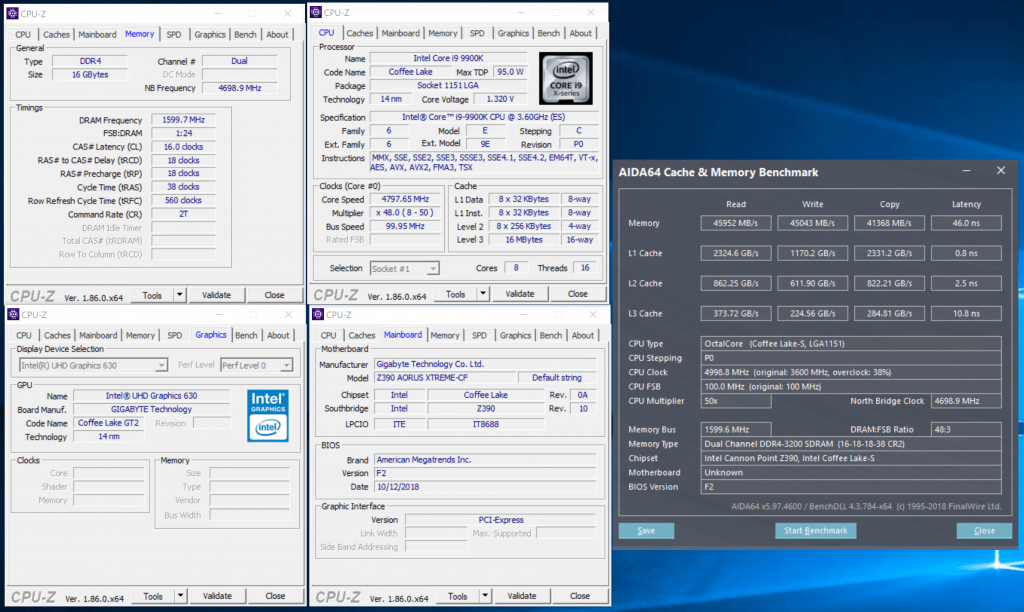
At stock speeds, the AIDA64 speeds for memory were decent. However, the latency was considered high, which was likely due to the loose timings on the XMP profile of the AORUS RAM kit.
Storage Performance
CrystalDiskMark
CrystalDiskMark is designed to quickly test the performance of your hard drives. Currently, the program allows measuring sequential and random read/write speeds.
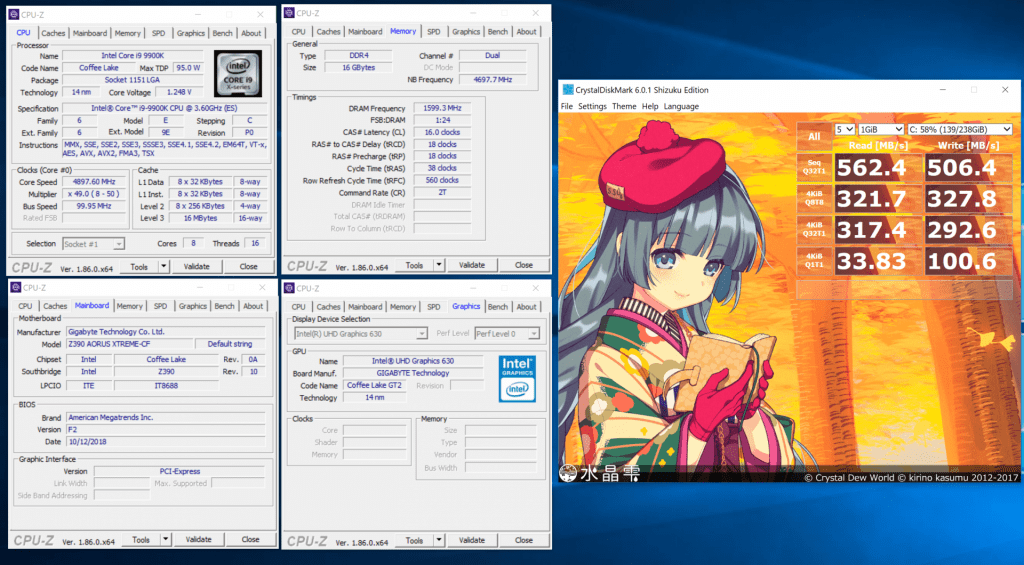
The motherboard was also able to be fully compatible with SSD devices as well. The Plextor M.2 SATA based SSD which was placed in the first M.2 slot operated at its maximum possible speed for the benchmark, and the results were expected.
ATTO Disk Benchmark
ATTO Disk Benchmark is a widely used software used to measure storage system performance. It runs various read and write tests with different test data to see performance of the disk under different scenarios.
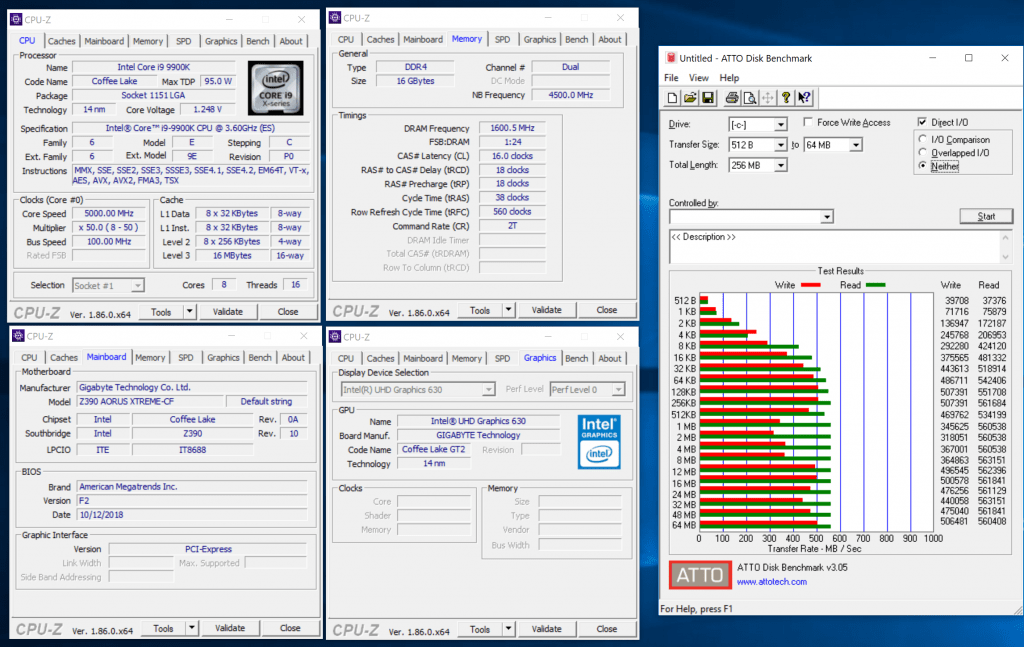
The results on the ATTO Disk benchmark is similar to those in CrystalDiskMark.
AS SSD Benchmark
The AS SSD benchmark determines the performance of Solid State Drives (SSD). The tool contains six synthetic and three copy tests. The synthetic tests determine the sequential and random read and write performance of the SSD. These tests are performed without using the operating system cache. In the sequential test, the program measures how long it takes to read and write a 1 GB file. In the 4K test, read and write performance is determined for randomly selected 4K blocks.
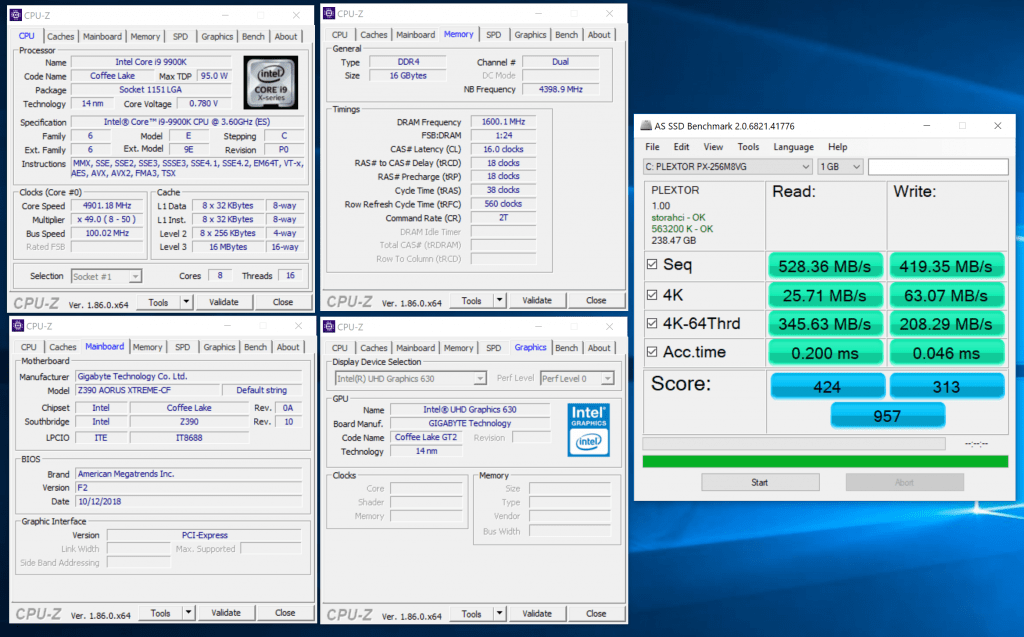
AS SSD does a more practical and thorough test on the SSD. The results were expected, but were lower than those from ATTO and CrystalDiskMark. This is due to a more practical approach which the benchmark uses, which shows a more real example of the result during actual usage.
Synthetic Graphics Performance (Intel HD Graphics 630 iGPU)
3DMark Firestrike
Fire Strike is a showcase DirectX 11 benchmark designed for today’s high-performance gaming PCs. It is our most ambitious and technical benchmark ever, featuring real-time graphics rendered with detail and complexity far beyond what is found in other benchmarks and games today.
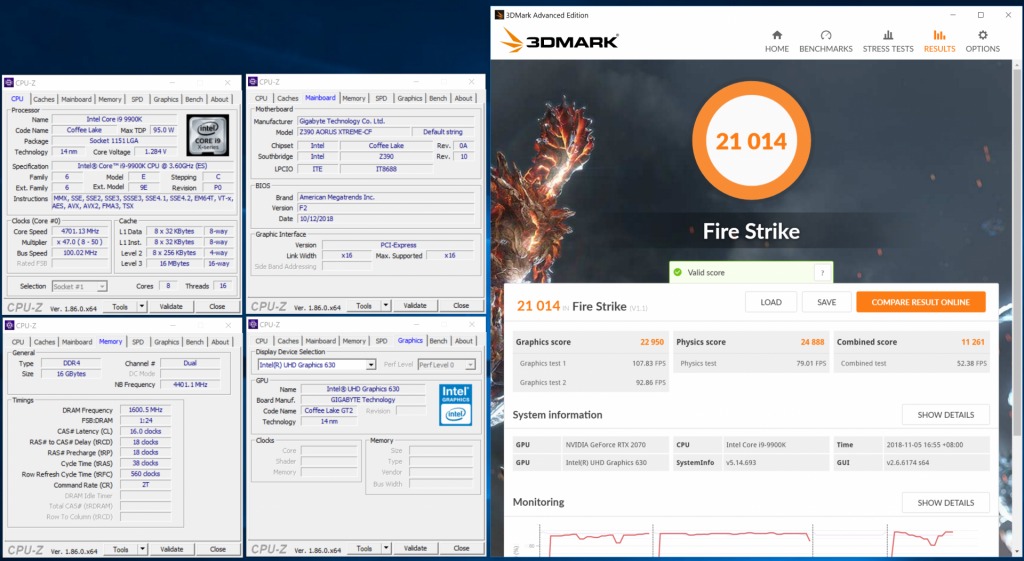
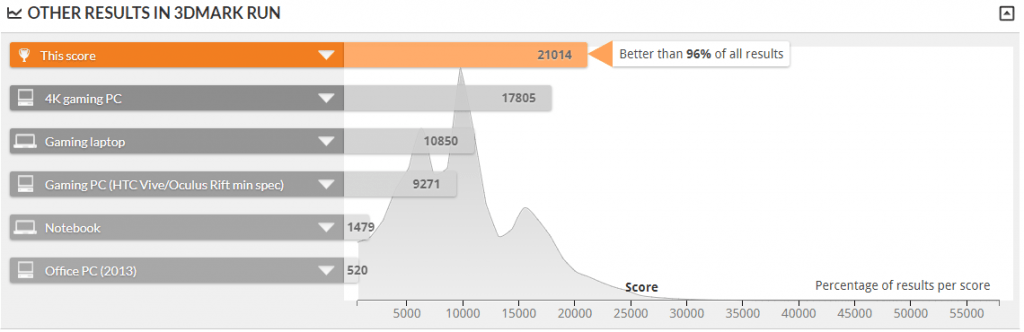
This time, we had the dedicated RTX 2070 graphics card added into the system. It was obvious that the score on these synthetic gaming benchmarks will be near the top, as we are using one of the best of the best CPU and GPU available in the market today. This also shows that the motherboard was able to support the integration of both CPU and GPU on games, working well together in such benchmarks.
3DMark Timespy
3DMark Time Spy is a new DirectX 12 benchmark test for Windows 10 gaming PCs. Time Spay is one of the first DirectX 12 apps to be built “the right way” from the ground up to fully realize the performance gains that the new API offers. With DirectX 12 engine, which supports new API features like asynchronous compute, explicit multi-adapter, and multi-threading, Time Spy is the ideal test for benchmarking the latest graphics cards.
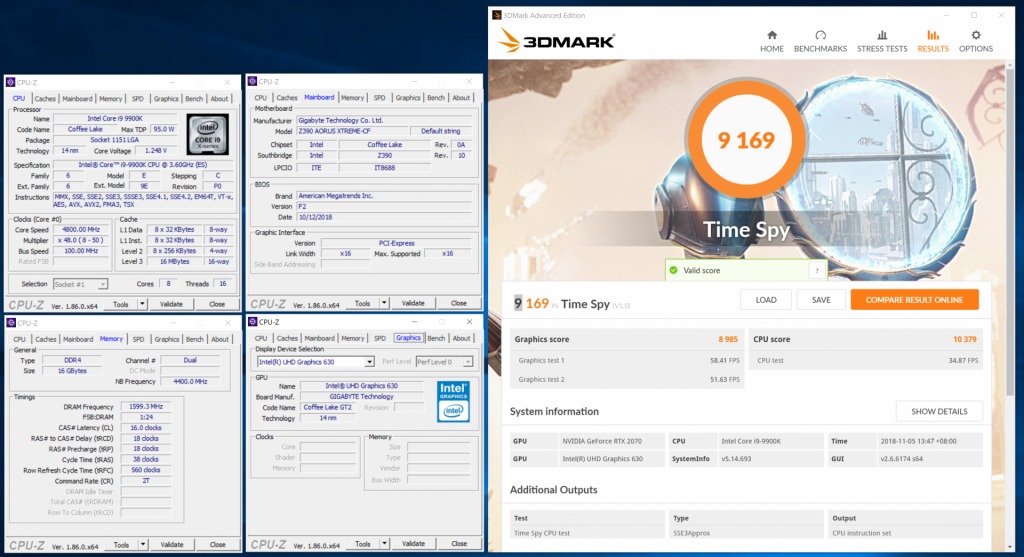
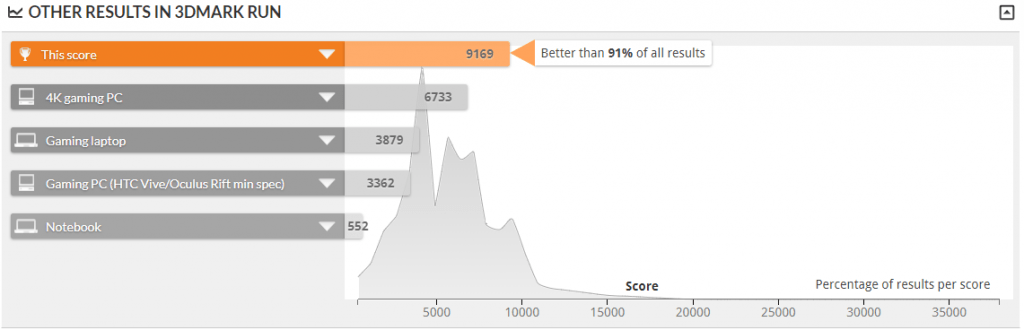
Similar to the FireStrike test, the TimeSpy test results were also great. The system came up in the 91% percentile.
Gaming Performance
Final Fantasy XV (RTX 2070)
The test is completed in 1920 x 1080 resolution in High Quality Preset.
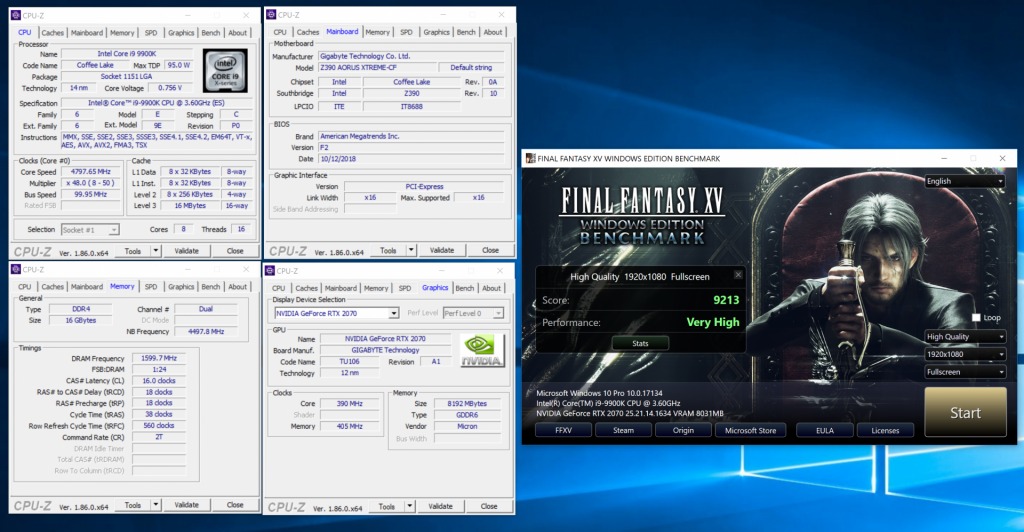
In our first game, the Final Fantasy XV was extremely playable, as it reaches a score of 9213 points and was determined to have a performance of “Very High”.
Total War: Warhammer (RTX 2070)
The test is completed in 1920 x 1080 resolution in Ultra Preset
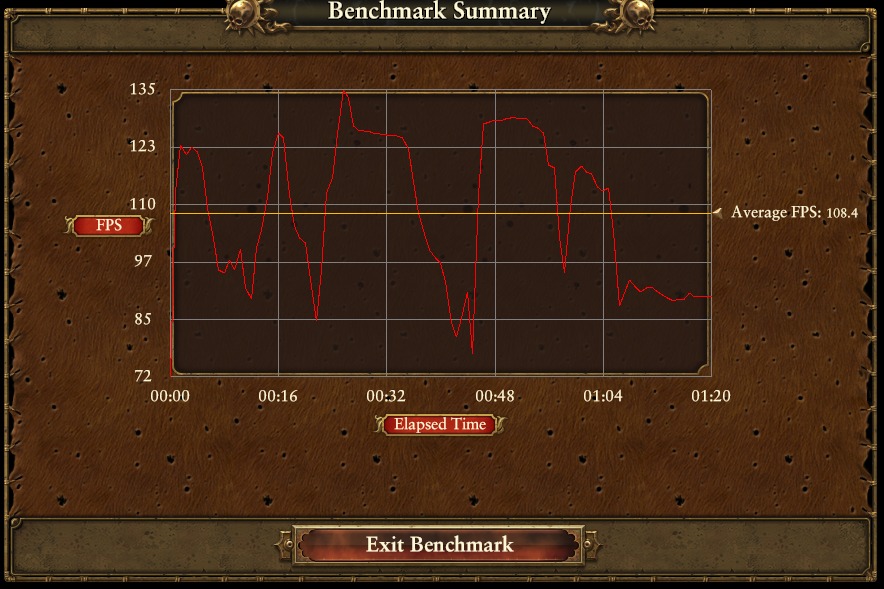
Total War: Warhammer relies a lot on the CPU. Therefore, its FPS is largely affected by the performance of the CPU. Thanks to the new CPU from Intel, coupled with the new RTX 2070, the test result was beautiful. It had an average of 108.4FPS. Even at its lowest point, the frame rates were at about 75FPS, far higher than the 60FPS/60Hz refresh rate of the monitor.
Deus Ex: Mankind Divided (RTX 2070)
The test is completed in 1920 x 1080 resolution in Ultra Preset
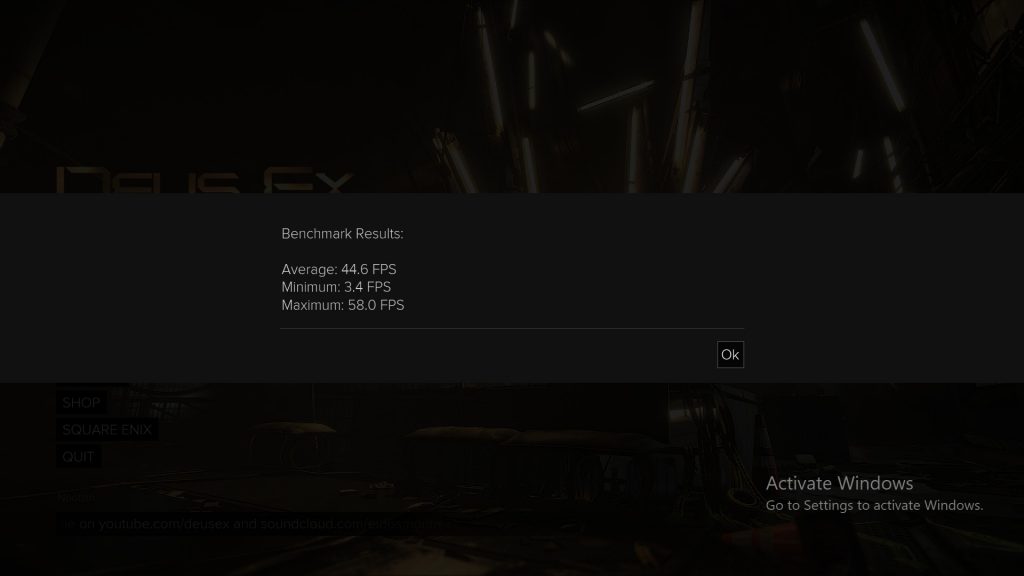
With all the settings maxed out, the Deus Ex benchmark gave a result of 44.6FPS. However, the minimum frame rate of 3.4FPS is alarming. It could be due to the software or driver issue that caused that significant stutter for that moment, resulting in this result. Regardless, the benchmark completed without any major hiccups.
Street Fighter IV (iGPU)
The test is completed in 1920 x 1080 resolution with all settings maxed out, but no Anti-Aliasing enabled
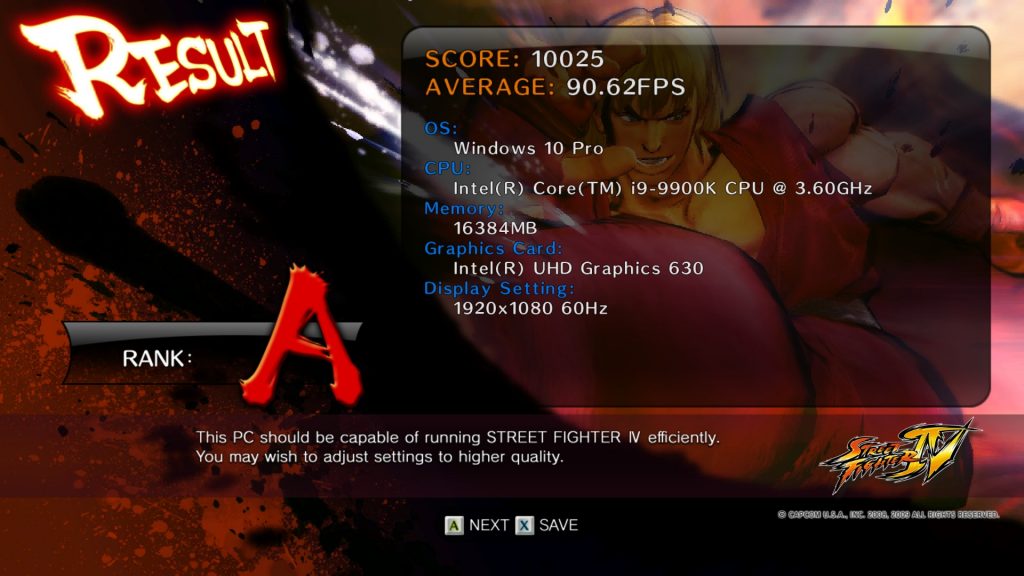
Lastly, we tested the Intel HD Graphics 630 on a DirectX 9 game. It was able to run Street Fighter IV smoothly with an average frame rate of 90FPS. This means that the integrated graphics is still decent enough for games which only requires simple graphics.


Hello,
Is the Thunderbolt controller Titan Ridge or Alpine Ridge?
You can find out by opening Thunderbolt Software and posting screenshot of the “About” dialogue.
If you cannot post screenshot, please tell the NVM version and Thunderbolt controller – is it 1577, 15D2 or 15EB?
Thank you!